
How EtG Detection Works: Half-Life, Elimination & Cutoffs
This guide explains how EtG is measured, how quickly it leaves your body, what the common 100 and 500 ng/mL cutoffs mean, and the exact formula behind our estimates. If you just want to run your numbers, go straight to the calculator. If you want to understand why it gives the answers it does, keep reading.
What Is EtG and How Is It Measured?
EtG (ethyl glucuronide) is a minor by-product of alcohol. After you drink, your liver breaks down most of the alcohol in one way, but a small share gets attached to a molecule called glucuronic acid, which creates EtG. That share is tiny. Even so, EtG is easy to measure and stays in the body much longer than alcohol itself, which is why it is used as a marker of recent drinking.
Labs can measure EtG in urine, blood, and hair. Urine is the most common choice, because EtG levels there are much higher than in blood and the detection window is longer. Hair tests look much further back, but they are slow to show very recent drinking.
How Labs Measure EtG?
There are three common approaches:
- Immunoassay screening: a fast, lower-cost test often used as a first step.
- LC-MS/MS: a laboratory method that separates and measures EtG very precisely. It is widely used to confirm a screening result, and many labs measure a second marker, EtS, at the same time.
- On-site cups and strips: convenient, but generally less precise than laboratory testing.
Results are reported in nanograms per milliliter (ng/mL). For reference, 1 mg/L equals 1,000 ng/mL, so a cutoff of 0.1 mg/L is the same as 100 ng/mL. The lab compares your result with its cutoff. At or above the line is positive, and below is negative. Some labs also require EtS to be present before they report a positive.
EtG Half-Life and Elimination Rate
Half-life is the time it takes for a level to fall by half. If your EtG is 800 ng/mL now and the half-life is 4 hours, it will be about 400 ng/mL in 4 hours, 200 in 8 hours, and 100 in 12 hours.
What Studies Report?
In a controlled research study of ten healthy men, EtG was eliminated with a median half-life of 2.2 hours (range 1.7 to 3.1 hours). Other research on blood samples describes a terminal half-life of about 2 to 3 hours. In heavy drinkers monitored during detox, the median was 3.3 hours (range 2.6 to 4.3 hours), although one patient in that group was recorded at nearly 12 hours.
Our calculator uses three half-lives: 2.5 hours for fast metabolizers, 3.75 hours as the central estimate, and 5 hours for slow metabolizers. These sit around the published figures and stretch toward the slow side, because people really do vary.
How Elimination Behaves Over Time?
EtG does not leave at a steady pace. Each half-life removes half of whatever is left, so the level drops quickly at first and then more and more slowly. It never truly hits zero. It just falls below the level a test can detect. This is why the final stretch toward a cutoff can take longer than people expect.
Half-life is also not the same thing as detection time. Half-life tells you how fast the level falls. Detection time also depends on how high the level started and where the cutoff is set.
What Changes the Rate?
- How much alcohol you drank, since a higher starting point takes longer to fall
- Individual differences in metabolism, which studies show can be large
- Kidney function and how concentrated your urine is
- Urinary tract infections, which can interfere with EtG in a sample
- Drinking on earlier days, which can add to what is already in your system
Using the Calculator as an EtG Half-Life Calculator
Our tool works as an EtG half-life calculator and an EtG elimination calculator in one. It applies the three half-lives above to your estimated starting level and shows the fast-to-slow range. It also doubles as an EtG level calculator, because it estimates where your EtG might sit at the time of a urine test. You can try it any time on the EtG calculator page.
A Note on the Limits of One Half-Life
Real excretion is not one clean curve. EtG can keep rising for a short time after drinking stops, and the tail end can be slower than the early drop. Our model starts the clock at your last drink and uses one half-life at a time, so the first hours after drinking are the least certain part of the estimate.
EtG Detection Cutoffs: 100 ng/mL vs. 500 ng/mL
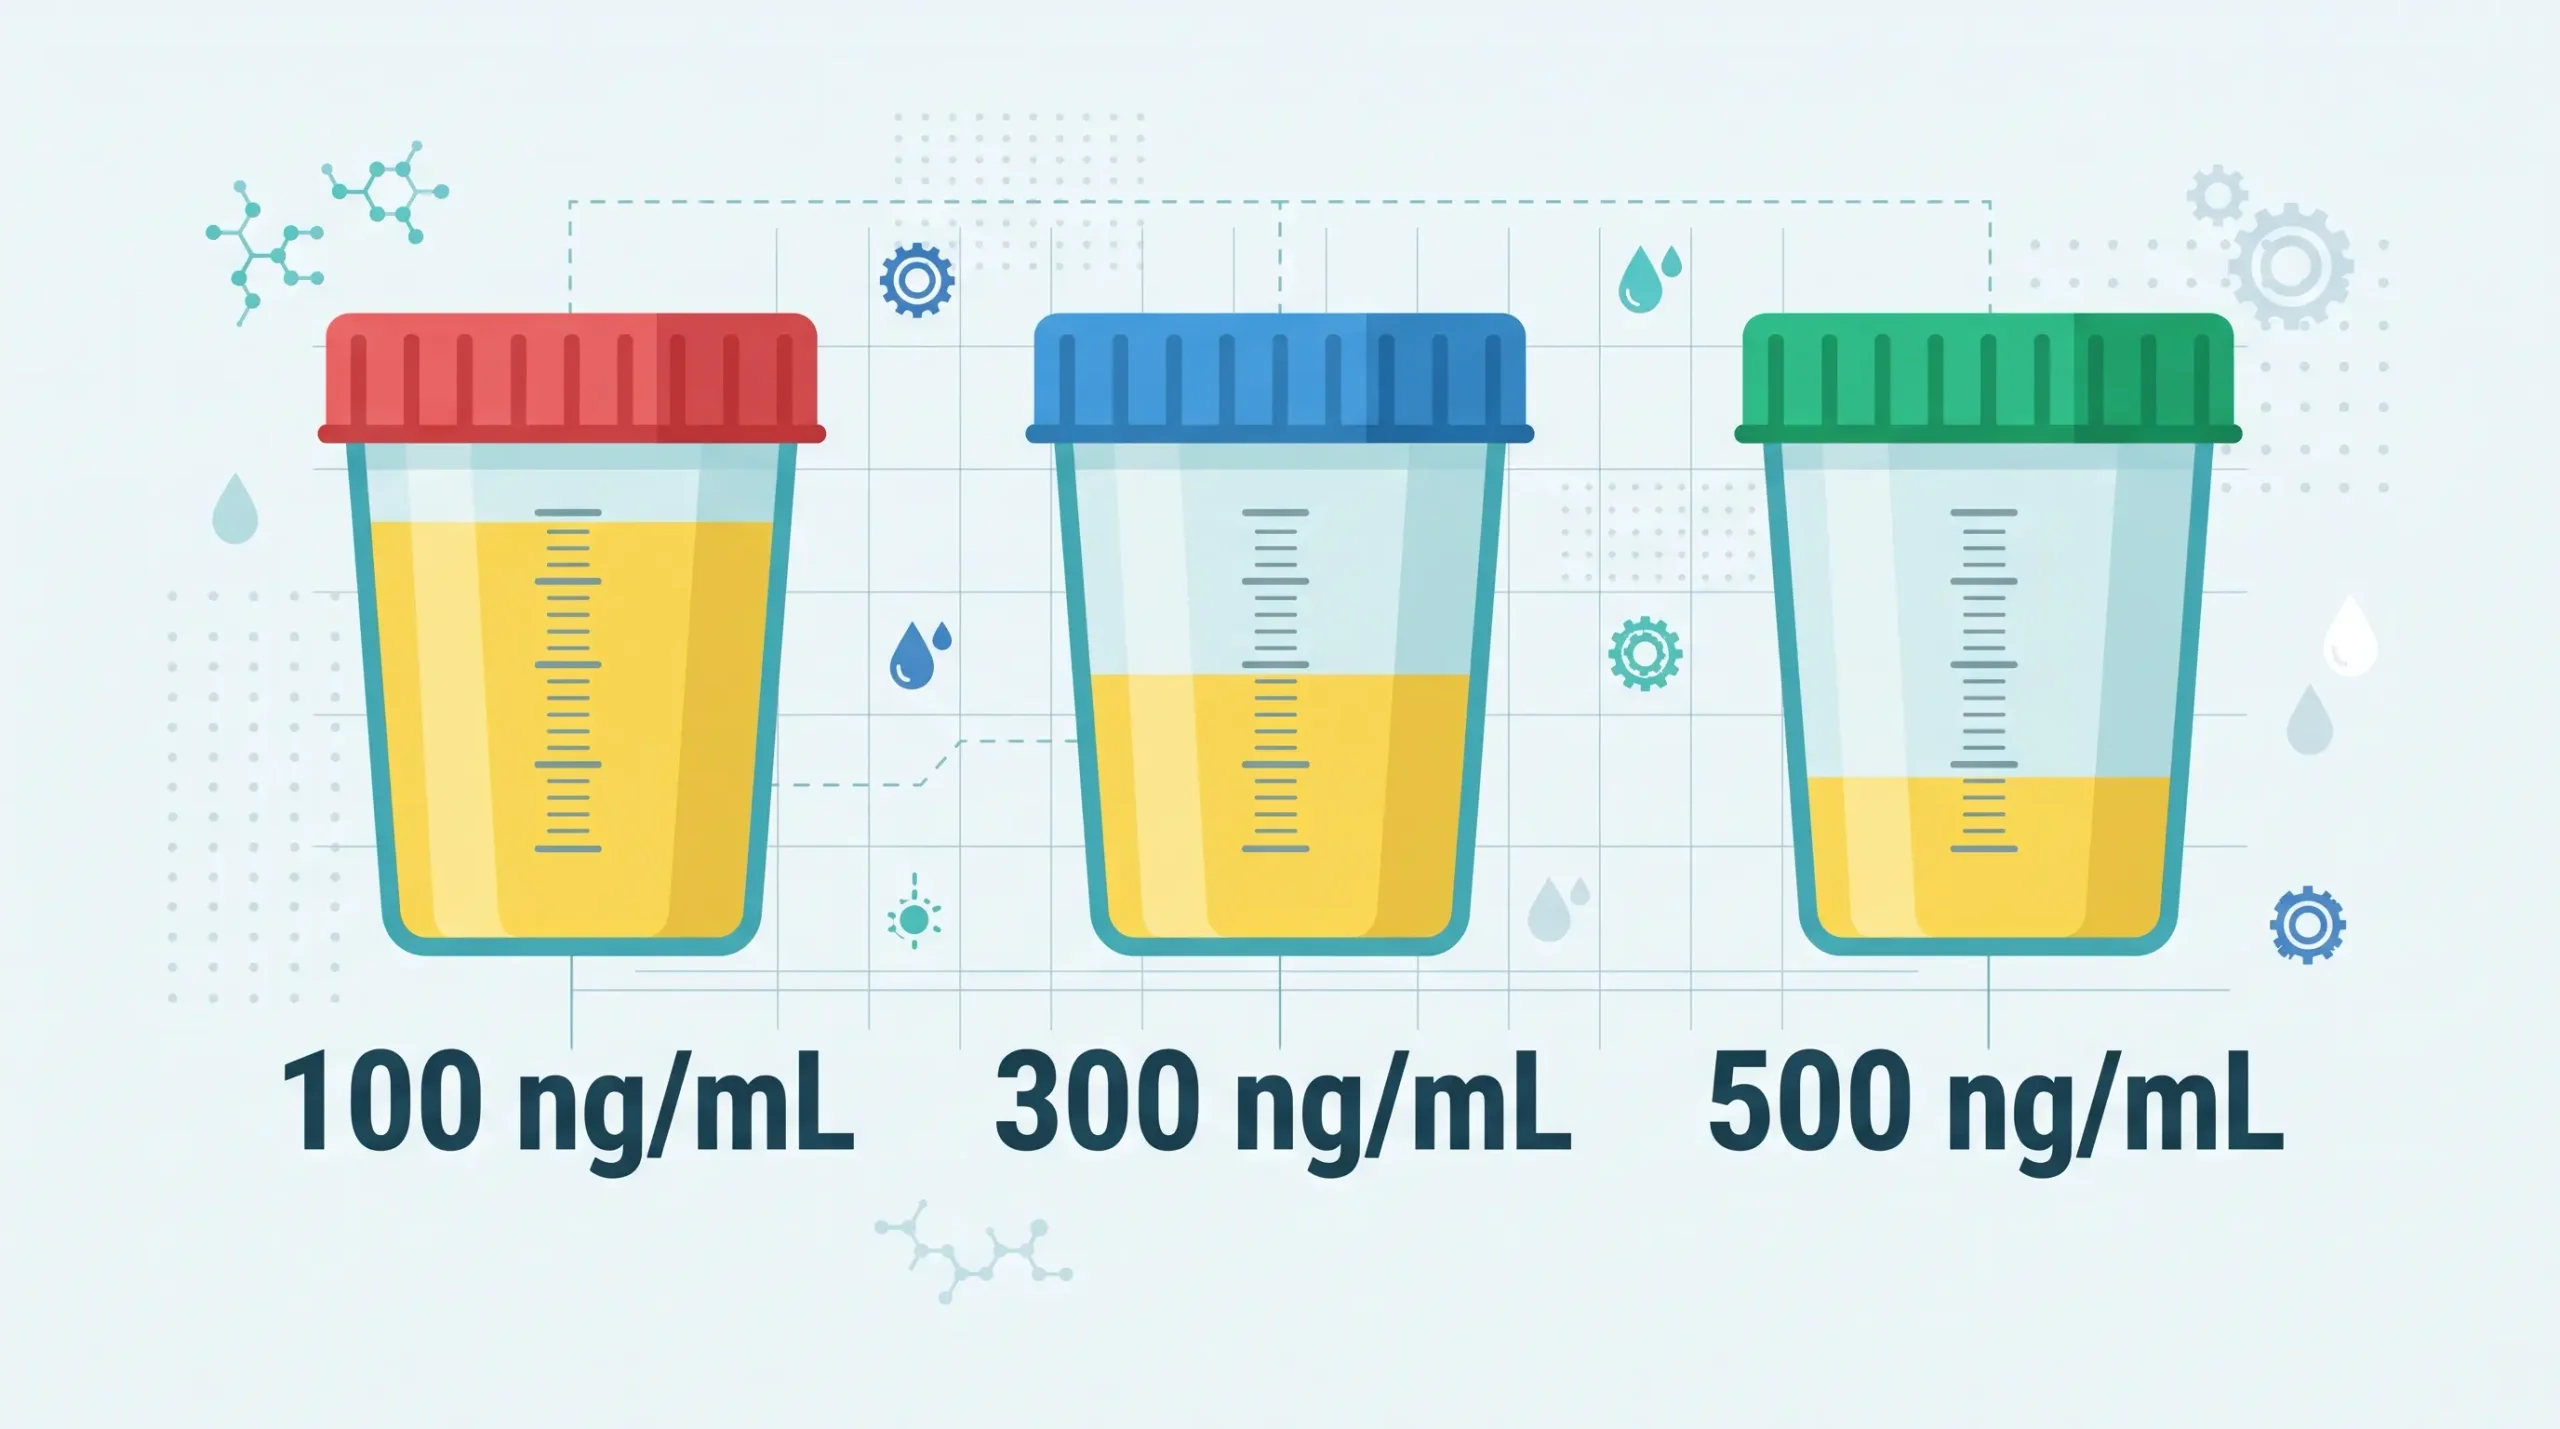
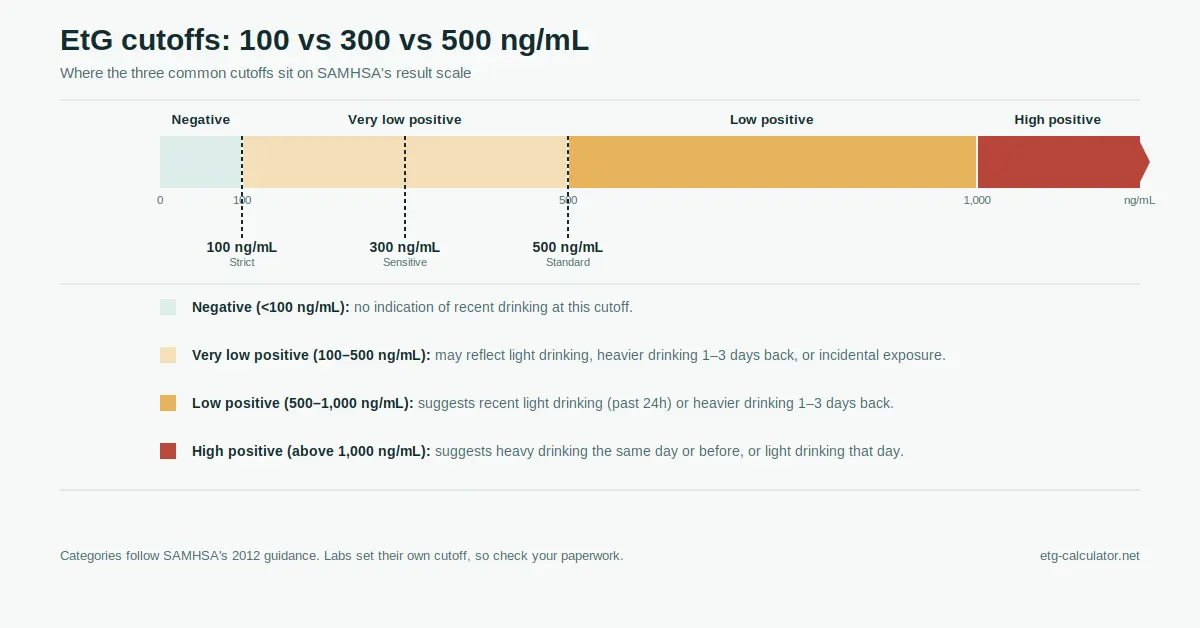
A cutoff is the line a lab draws between negative and positive. Labs choose the line, and they do not all choose the same one. Commonly used cutoffs run from 100 to 1,000 ng/mL. The two you will see most often are 100 and 500.
The 100 ng/mL Cutoff
This is the most sensitive of the common settings. It catches smaller amounts of alcohol and picks up drinking from further back. In a study that compared cutoffs from 100 to 500 ng/mL across 1,589 samples, 100 ng/mL had the highest sensitivity and the lowest specificity. In a low-dose part of that research, the 100 and 200 ng/mL cutoffs caught every case at 12 hours, while 500 ng/mL caught only half.
The trade-off is that a low cutoff is also more likely to register incidental exposure, such as alcohol-based hand sanitizer or mouthwash. SAMHSA’s 2012 guidance says a result between 100 and 500 ng/mL may reflect previous heavy drinking (1 to 3 days), previous light drinking (12 to 36 hours), or recent incidental exposure.
The 500 ng/mL Cutoff
SAMHSA’s 2012 advisory recommended a relatively conservative cutoff of 500 ng/mL to reduce positives caused by incidental exposure. The trade-off runs the other way: it can miss light or older drinking. SAMHSA describes 500 to 1,000 ng/mL as pointing to previous heavy drinking (1 to 3 days) or recent light drinking (the past 24 hours), and results above 1,000 ng/mL as pointing to heavy drinking on the same day or the day or two before, or light drinking the same day.
Where 300 ng/mL Fits?
Some labs report at values between the two extremes, such as 250 ng/mL. We include 300 ng/mL as a middle setting so you can see how an estimate changes between the strictest and most conservative cutoffs.
Which Cutoff Will Your Test Use?
That depends on the lab and the program, so check your paperwork or ask. If you searched for an EtG calculator 100 ng setting or an EtG 500 calculator, you do not have to choose. Our tool works as an EtG detection calculator that checks your estimated level against 100, 300, and 500 ng/mL at the same time and marks each as above or below. Think of it as a detection EtG level calculator that shows how much the cutoff matters.
Calculating EtG by Date and Time
Many people look for an EtG date and time calculator, because what they have is a date and time for the last drink and a date and time for the test. Our calculator asks for hours instead of clock times, so here is how to convert.
How to Turn Dates and Times Into Hours?
- Hours spent drinking: subtract the time you started from the time you finished. If you started at 7:00 PM and finished at 11:30 PM, that is 4.5 hours.
- Hours since your last drink: subtract the time of your last drink from the time the sample will be collected. If your last drink was Saturday at 11:30 PM and the test is Monday at 9:30 AM, that is 34 hours.
- Enter both numbers along with your drinks, weight, and sex, then click Calculate.
If you are not sure of the exact test time, run the estimate a few times with slightly different hours to see how sensitive the result is to timing.
Why Timing Changes the Result So Much?
Because EtG falls by half with every half-life, a few hours can make a big difference. Here is how much of the peak level is left at different points, using our three half-lives:
- After 6 hours: about 19% (fast), 33% (central), 44% (slow)
- After 12 hours: about 3.6% (fast), 11% (central), 19% (slow)
- After 24 hours: about 0.13% (fast), 1.2% (central), 3.6% (slow)
- After 48 hours: well under 0.01% (fast), about 0.01% (central), about 0.13% (slow)
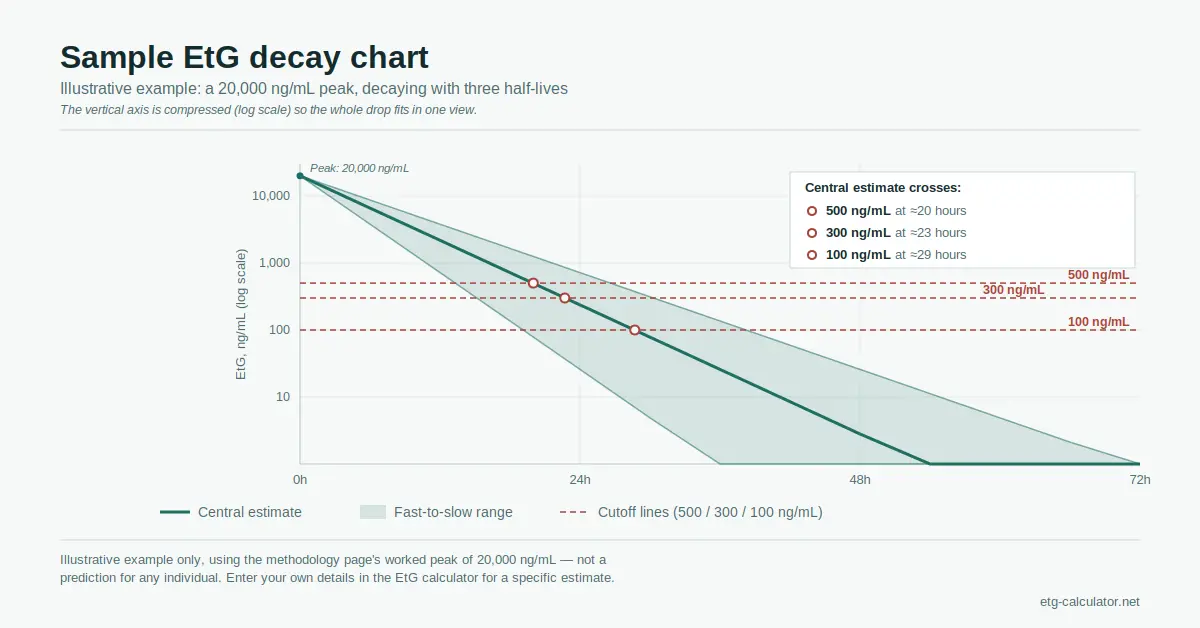
For example, if a peak level of 20,000 ng/mL is used purely to show the math, then 24 hours after the last drink the estimate would be roughly 26 ng/mL (fast), 240 ng/mL (central), and 720 ng/mL (slow). The central estimate sits above a 100 ng/mL cutoff but below a 500 ng/mL cutoff. That is exactly the kind of difference the cutoff makes. Anyone looking for a date and time calculator for EtG will find that the hours-based inputs above give the same answer.
The Formula Behind the Calculator
Here is the full EtG calculator formula, step by step, so you can check our work.
Step 1: Grams of Alcohol
A standard beer, wine, or liquor serving counts as about 14 grams of pure alcohol (a 12 oz beer at 5%, a 5 oz glass of wine at 12%, or 1.5 oz of 40% liquor). For a Custom drink:
Grams per drink = ounces × 29.57 × (ABV ÷ 100) × 0.789
Here 29.57 converts ounces to milliliters and 0.789 is the density of alcohol in grams per milliliter. Total alcohol (A) = grams per drink × number of drinks.
Step 2: Peak Blood Alcohol (Widmark Formula)
Peak BAC (%) = A ÷ (r × W × 10) − (β × hours spent drinking)
- W is body weight in kilograms (pounds ÷ 2.2046).
- r is the Widmark body-water factor: 0.68 for males, 0.55 for females, and 0.615 if you choose not to say.
- β is the rate the body clears alcohol, in % BAC per hour. Our calculator uses [β value].
- The result cannot go below zero.
Step 3: Peak Urine EtG
[Fill in exactly how your calculator converts peak BAC into peak urine EtG, including the constant, its units, and the name and year of the published controlled-dosing study it was calibrated against.] In plain terms, a higher peak blood alcohol leads to a higher peak EtG, scaled by a constant calibrated against measurements from real drinking studies.
Step 4: Decay Over Time
EtG at time t = Peak EtG × (1/2)^(t ÷ half-life)
Here t is the hours since your last drink, and the half-life is 2.5, 3.75, or 5 hours, which produces the fast, central, and slow estimates.
Step 5: Time Above a Cutoff
To estimate how long EtG stays at or above a cutoff, we rearrange the decay formula:
Hours = half-life × log₂(Peak EtG ÷ cutoff)
A Worked Example
Take 4 standard drinks, a male weighing 80 kg, spread over 4 hours, using an example β of 0.015 [match this to your calculator].
- Step 1: 4 × 14 g = 56 g of alcohol.
- Step 2: 56 ÷ (0.68 × 80 × 10) = 0.103%, minus 0.015 × 4 = 0.060%, gives a peak BAC of about 0.043%.
Step 3 depends on the calibration constant, so to show the decay math we start from an example peak EtG of 20,000 ng/mL. This number is only an illustration. Using the three half-lives, the time EtG stays at or above each cutoff works out like this:
- 500 ng/mL: about 13.3 hours (fast), 20.0 hours (central), 26.6 hours (slow)
- 300 ng/mL: about 15.1 hours (fast), 22.7 hours (central), 30.3 hours (slow)
- 100 ng/mL: about 19.1 hours (fast), 28.7 hours (central), 38.2 hours (slow)
Reading the Decay Chart
The EtG calculator chart plots your estimated EtG level against time on a log scale. A log scale turns the curved drop into a straighter line, which makes it easier to see how the levels change across a very wide range of numbers. The shaded band shows the spread between the fast and slow half-lives. Dashed lines mark the 500, 300, and 100 ng/mL cutoffs, and a marker shows where you are right now. Where the band crosses a dashed line, the estimate changes from above that cutoff to below it. To understand see the image below.
What the Formula Leaves Out?
The model describes one drinking session and one simplified elimination rate. It does not know your kidney function, how concentrated your urine is, whether you drank on earlier days, or what lab method and cutoff will be used. It also cannot account for incidental exposure to alcohol in everyday products. Real measurements show large differences between people, so treat every result as an estimate, not a prediction.